Ten Key Climate Indicators
10 min read
With global emissions once again on the rise, there is a renewed sense of urgency to reduce emissions and limit . At the same time, economic development remains extremely uneven across the globe with regard to access to energy, food and healthcare. As a result, solutions have to address both of these challenges to achieve continued yet . The ten indicators below illustrate this relationship.

© FABRICE COFFRINI / AFP
1 – Global (CO2) Emissions Trends
After three stable years, carbon dioxide CO2 emissions are on the rise again.
|
|
Rise in emissions (energy-related) |
|
2013 |
+ 0,6 % |
|
2014-2015-2016 |
Stable |
|
2017 |
+1,5 (forecast) |
|
2018 |
+2 % (forecast) |
According to the , to avoid an average temperature rise of more than 1.5°C by 2100, emissions must be reduced 45% from 2010 levels by 2030 and reach net-zero by 2050.
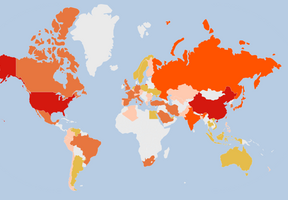
2 – Emissions Trends Over 25 Years by Country
China’s energy-related carbon emissions have more than tripled in the last 25 years, while Europe’s have been reduced by one-fifth1.
|
|
2015/1990 change |
|
China |
+330 % |
|
India |
+290 % |
|
United States |
+4 % |
|
Europe |
-20 % |
China has begun to curb its increasing emissions and has committed to reducing them by “around 2030”. Even with Europe’s decrease in emissions, reductions fall significantly short of achieving the goal of carbon neutrality by 2050.
3 – Atmospheric Carbon Dioxide Concentration
Carbon dioxide concentration reached 403 ppm in 2016.
Carbon dioxide concentration is not the same as CO2 emissions. It indicates how much carbon remains in the atmosphere after interactions with the air, biosphere and oceans. About one quarter of total CO2 emissions are absorbed by the oceans and another quarter by the biosphere. Since the 1980s, carbon dioxide levels in the atmosphere have increased steadily, exceeding 400 ppm in 2014. The IPCC has estimated that this figure needs to stabilize at an average of 450 ppm.
If levels continue to increase at the current rate, this threshold will be reached by 2045.
4 - Temperature
- The average global temperature is currently advancing by 0.2°C per decade.
- It has already risen by around 1°C since pre-industrial times (1850 by convention).
- At current emissions rates, the average global temperature will have increased by 1.5°C by between 2030 and 2052, and 3°C by 2100.
5 – Sea Levels
Sea levels rose by an average of 1.7 millimeters per year between 1901 and 2010.
However, between 1993 and 2010 this rate increased to 3.2 millimeters per year.
6 – Major Differences Across Countries and Regions
Even though total emissions are compared among multiple countries, it is important to remember that these levels are associated with often very different populations.
| Emissions in Gt CO2 | Metric tons of CO2 per capita | |
| China | 9,10 | 6,57 |
| Unites States | 4,8 | 14,95 |
| India | 2,1 | 1,57 |
| Africa | 1,2 | 0,95 |
| Germany | 0,73 | 8,93 |
| France | 0,29 | 4,38 |
| Qatar | 0,08 | 35,77 |
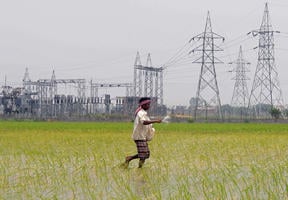
7 – Access to Electricity
Greenhouse gas emissions reflect energy consumption and therefore growth. However, development remains very uneven, with 1 billion people worldwide living without access to 3. Some examples illustrating this point are provided below.
| Acces to electricity in 1990 | In 2016 | |
| World (average) | 71,4 % | 87,4 % |
| China | 92,2 % | 100,0 % |
| India | 43,3 % | 84,5 % |
| South Africa | 59,3 % | 84,2 % |
| Burundi | 0,3 % | 7,6 % |
| Indonesia | 61,7 % | 97,6 % |
| Nicaragua | 66,8 % | 81,8 % |
8 – Food Needs
Farming and ranching are responsible for 24% of global greenhouse gas emissions (11% from crop farming, ranching and rice farming; 10% from changes in land use, mainly due to deforestation; and 3% from forest and peat fires).
According to the Food and Agriculture Organization (FAO), the absolute number of undernourished people, i.e., those facing chronic food deprivation, increased to nearly 821 million in 2017, from around 804 million in 2016.
Solutions include preserving land and forests as carbon sinks, producing renewable materials and energy, and promoting agroecology.
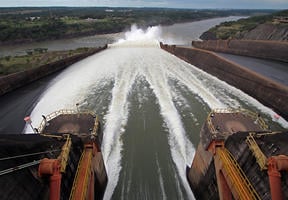
9 – Coal’s Continued Dominance
Although produces the most greenhouse gas emissions of all the energy sources, it continues to dominate electricity production4. Its share in the generation mix has remained steady for 30 years and there is no reason to believe its use will drop any time soon, either in the United States or in Asia.
| 1990 | 2016 | |
| Coal | 37,5 % | 38,3 % |
| Hydropower | 17,5 % | 16,6 % |
| Nuclear | 16 % | 10,4 % |
| Gas | 15 % | 23,1 % |
| Oil | 11,5 % | 3,7 % |
| Renewables | 1,5 | 7,9 % |
10 – E.U. Objectives
By 2030, the European Union aims to have achieved the following objectives5 :
- A minimum 40% reduction in greenhouse gas emissions from 1990 levels.
- A minimum of 32% renewables in the .
- A minimum improvement in of 32.5%.
The European Commission advocates carbon neutrality by 2050.
Sources :
- Source AIE
- Carbon dioxide concentration is measured in . A figure of 403 ppm means that for every million molecules in the atmosphere, 403 are carbon dioxide.
- World Bank
- AIE
- Source Europa
 This may interest you
See all