Electricity Generation and CO2 Emissions
10 min read
is an invisible mainstay in our daily lives and powers our industries, homes, modes of transport and technologies. The processes used for its generation, however, also make it one of the leading sources of CO2 emissions. As electrification worldwide continues to increase, the transition from fossil fuels to renewable energies is crucial. A major challenge for our future!

© EDF / GROLLIER PHILIPPE - Electricity is used in a wide variety of areas including industry, housing and transportation, such as here for a tram in the city of Toulouse.
Electricity generation methods
- Fossil fuel-fired power plants: they burn fossil fuels (mainly and natural gas) or (household or plant waste). The combustion produces steam, which rotates a turbine connected to a generator, which converts the mechanical movement into electrical energy. Coal and gas plants are the most common and the biggest CO2 emitters. Oil, in the form of fuel oil, is seldom used in the industry to generate electricity.
- Nuclear power plants: is produced by the fission of -235 or plutonium-239 atoms in a reactor. In this case too, steam drives the rotation of a turbo generator.
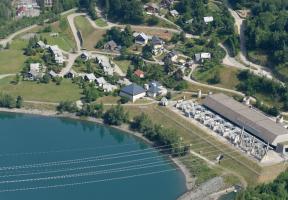
- Hydropower plants: they are also equipped with turbines and use the energy of water, either by capturing the energy of a waterfall in the mountains or by holding up the flow of a major river or an estuary.
- Wind farms: wind turbines capture the wind’s energy with their huge blades to drive the turbines. or wind farms often comprise several dozen turbines.
- Solar farms: they include thousands of solar panels primarily composed of semi-conductor materials such as . They convert sunlight directly into electricity.
- Emerging technologies: some harness the energy of the ocean (wave swell, currents, etc.). The heat deep beneath the Earth's surface ( energy) can also be used to generate electricity. Concentrated solar power plants capture the sun’s heat to warm up a fluid and drive the turbine. , used in fuel cells, holds great development prospects.
From fossil fuels to renewable energies
Global electricity generation is growing exponentially. Having increased by 50% between 2010 and 2022, it is expected to undergo 100% growth, i.e. double the initial figure, between 2022 and 2040. It should then increase by a further 25% between 2040 and 2050. “Global electrification” is due to the development of electric vehicles, domestic heating, electronic devices, the automation of factories, and of course, the growing world population.
This spectacular increase will go hand in hand with a step change in production sources that will transition from fossil fuels to renewable energies, particularly wind and solar. The table below explains this revolution in simple terms, showing the respective shares of the main energy sources in global electricity generation. This is the scenario put forward by the to achieve by 2050.
Share of energy sources in global electricity generation (IEA scenario)
| Energy Sources | 2022 | 2050 |
| Coal | 36% | 0% |
| Natural gas | 22% | 0% |
| Oil (fuel) | 2% | 0% |
| Nuclear | 9% | 8% |
| Hydro | 15% | 11% |
| Wind | 7% | 31% |
| Photovoltaic | 4% | 41% |
In this scenario, the share of fossil fuels would drop from 60% to almost zero and that of renewables would increase from 26% to 89% (with the contribution of bioenergies, solar thermal systems, geothermal energy and ocean energies).
Electricty and greenhouse gases
In 2022, electricity generation was responsible for around 40% of global CO2 emissions. Among these electricity-related emissions, coal plants accounted for 73% and gas plants for 22%. There is indeed a huge disparity between the different types of production. The table below gives an indication of the CO2 emissions of each type of plant based on the calculations of the IPCC. They are expressed in grams equivalent CO2 per kWh (gCOe/kWh), and include the emissions generated by plant construction, those attributable to electricity production per se, and those due to waste where applicable. There are also other factors at play, such as where the materials were manufactured or the age of the plants. These are consequently average figures, which vary greatly from one country to the next.
CO2 emissions per type of plant
| Type of plant | Emissions (gCO2e/kWh) |
| Coal | 820 |
| Oil (fuel) | 600 |
| Natural gas | 490 |
| Photovoltaic | 48 |
| Hydro | 24 |
| Nuclear | 12 |
| Wind | 11-12 |
 This may interest you
See all