United States: Shale Gas and Renewables Turn the Tables
10 min read
The large expanses of shale
exploitation, as well as solar and wind farms, facilitated by the vast geographical space available in the US, haves profoundly changed the country's
mix.
use has declined, leading to lower
emissions. However, the policies of the federal government in Washington are undergoing dramatic shifts, creating uncertainty and disrupting international action against
.

© ANDREW CABALLERO-REYNOLDS / AFP
The Rise of Shale Hydrocarbons
The rise of and shale oil in the late 2000s revolutionized the US energy landscape. These hydrocarbons, extracted using a controversial technique known as , enabled the US to increase its gas production by 71% and more than double its oil production between 2009 and 2021.
This had two consequences:
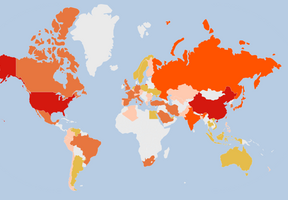
- The United States became the world's leading producer of oil and gas, enabling it to improve its and influence global balances.
- The United States was able to reduce its long-standing dependence on coal for electricity production. The shift occurred in 2017 when coal's share of the was surpassed by that of natural gas, which is less polluting and cheaper. In 2025, gas accounts for more than 43% of the electricity mix, relegating coal's share to 16%.
Coal Consumption in Decline
Available in large quantities, generally at low cost, and providing tens of thousands of jobs, coal has played an essential role, alongside oil, in American development since the late 19th century. It has long been referred to as “King Coal,” after the title of a 1917 novel by writer Upton Sinclair. In 1990, it still accounted for more than half of electricity production.
Fluctuations in Federal Policy
This goal is all the more difficult to achieve given that US federal policy, i.e., decisions made in Washington as opposed to those made in the 50 states, has undergone multiple upheavals since 2017.
The election of President Donald Trump in 2017 and his re-election in 2024 led to restrictive policies on , which were highly favorable to exploitation and contradictory to the international movement to combat . The United States even withdrew from the 2015 Paris Agreement in 2017 and 2025.
Renewable Energies
Despite federal policy shifts, renewable energy development continues.
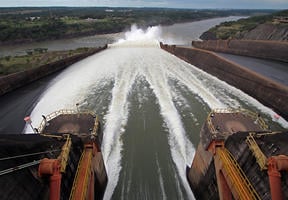
The vast expanses of land in the United States had already enabled the country to become a pioneer in hydroelectric . In the early 1930s, President Franklin Delano Roosevelt launched the spectacular Tennessee Valley Authority project as part of his New Deal program to develop a region hit by unemployment.
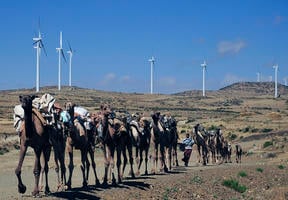
The rise of solar and wind technologies led the United States to build the largest and wind turbine farms starting in the 2000s. Although they have now been surpassed by projects in China and India, American installations in California and the Midwest still dominate the global rankings.
A wind farm such as the Alta Wind Energy Center in California has a capacity of over 1,500 megawatts (MW), equivalent to a large ( though it lacks the consistent output of a nuclear power plant). The Solar Star photovoltaic power plant in Rosamond, California, has a capacity of nearly 600 MW.
In 2023, wind power accounted for more than 10% of the electricity mix, solar power for nearly 4%, and hydropower for 5.5%. Nuclear power remained stable at below 19%.
Learn more:
 Geopolitics of energy
See all