Factsheet: Energy in France
10 min read
This educational factsheet provides a complete map of the energy situation in France. Discover the different energy sources used in the country, including fossil, nuclear and renewable energies. Commented tables help you understand the French energy system, its evolution and its action in favor of the climate.
Exercises and suggested educational activities complete this fact sheet. It can be used in an interdisciplinary way to prepare lessons on France in disciplines such as history-geography, economic and social sciences, physics-chemistry and engineering sciences.
A bit of History🧑🏫
The Industrial Revolution:
For over a century (1850 - 1960), the French energy system relied on , the energy behind the Industrial Revolution. Emile Zola published his novel Germinal in 1885.
After the First World War:
Oil became the new energy source. Coal production reached its peak in 1930 and declined as from the 1960s. The last French mine closed in 1990.
After the Second World War:
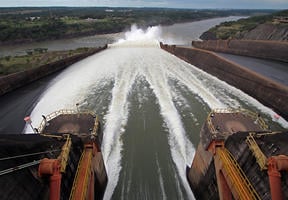
The 1950s marked the rise of hydroelectricity or “white coal”, and gas, with the production of the Lacq reservoir, located Southwest of France.
The 1973 Oil Crisis:
After the brutal rise in oil prices, France wanted to ensure greater and introduced an ambitious nuclear plan. Though blacklisted for a while at the beginning of the 21st century, nuclear remains a dominant energy source to produce electricity.
Early 21st Century:
It was not before the first decade in the 21st century that renewable energies - solar and wind power - began to develop, though not to the same extent as in Germany for example. The 2020s marked renewed interest in promoting these types of energy.
The Basics💡
The Energy Mix
The energy mix, defines the distribution of the different sources used for domestic energy consumption in a given country.
This table shows the consumption of primary energies in France in 2023 (expressed as a percentage).
Primary Energies | 2023 |
Coal | 2% |
Oil | 32% |
Natural gas | 14% |
Nuclear | 35% |
Hydro | 6% |
Renewables (excluding hydro) | 11% |
Source: Statistical Review of World Energy 2024
At the end of the chain, this table shows the share of final energy consumed by the different sectors in 2023.
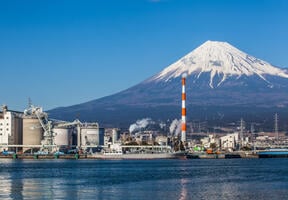
Industry | 2023 |
Transport | 34% |
Residential | 28% |
Industry | 18% |
Service | 17% |
Agriculture | 3% |
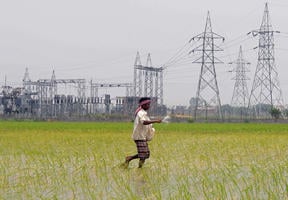
The Power Generation Mix
The power generation (or ) refers to the combination of various types of energy sources used to generate electricity in a given geographic region.
This shows the share of the different sources of electricity in 2023 in France (expressed as a percentage).
Power sources | 2023 |
Coal | 0.2% |
Oil | 0.3% |
Natural gas | 6% |
Nuclear | 65% |
Hydro | 11% |
Wind | 10% |
Solar | 4% |
Other renewables | 3% |
Source: Statistical Review of World Energy
- The share of nuclear power was 68.7% in 2021. French power stations underwent maintenance problems in 2022 and 2023.
- Wind power is on the rise, with the construction of new wind farms.
- The “other renewables”, include energies from (wood, incinerated waste, etc.), energy from the tide, the waves, currents or from the Earth ( energy).
Greenhouse Gases
Year | Emissions in millions of tons of CO2 equivalent |
2000 | 549 |
2010 | 507 |
2020 | 392 |
2021 | 415 |
2022 | 404 |
2023 | 385 |
Source:Statistical Review of World Energy
- Since 2000, the trend has significantly decreased due to the efforts made to fight .
- Certain events cause high annual variations, such as the COVID-19 pandemic, that slowed down the economy in 2020. The marked decrease in 2023 can be explained by the renewed presence of nuclear potential after technical incidents, and the positive response of the French population to encourage initiatives aiming to save energy to hold the price of natural gas.
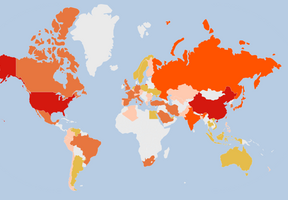
- In 2021, per inhabitant, emissions in France were 6 tons equivalent CO2 (9 in Germany, 10.7 in Poland).
Future Outlook
The aim is to achieve carbon neutrality by 2050 - that means not emitting more CO2 than we can absorb.
There are three main actions to achieve this:
- Reduce energy consumption by 40-50% by 2050, compared with 2021, with an intermediate stage at 30% in 2030. This means consumer ‘sufficiency’ and new technologies.
- Revive nuclear power: the current reactor will be extended over more than 50 to 60 years, six EPR2 reactors are due to be up and running in the next decade.
- Accelerate the development of renewable energies: 36 offshore (at sea) wind farms installed by 2035. The pace of photovoltaic energy, and district heating networks will be doubled by 2030.
What was the share of renewable energies in power generation in France in 2023?
28% (17% excluding hydro)
Are greenhouse gas emissions increasing or decreasing in France since the year 2000?
Definitely decreasing, with irregular increases depending on the year. The figures have dropped from 549 tons of CO2 in the year 2000 to 385 in 2023. But from 392 million tons in 2020, to 415 in 2021 (due to the economic recovery after the COVID-19 pandemic).
In history & geography, this factsheet can be used to cover the following topics on the middle- and high-school curriculums:
- and
- Geopolitical challenges related to energy
- Regional infrastructures and unequal access to energy
In economic and social sciences at high school, the factsheet gives figures on energy consumption and production in France, useful for studying the issues of saving energy and the ecological transition.
In physics & chemistry, information on different energy sources and their conversion can be used to illustrate the notions of energy conversion covered in the curriculum.
- Ask students to create a diagram to summarize the in France using data from the factsheet and ask them to think about the advantages and disadvantages of each energy source.
- Organize a debate in class on France’s energy objectives and the means for achieving them, based on the challenges described on the factsheet.
- Suggest an exercise to compare energy consumption in France and the UK, using the same “Factsheet: Energy in the United Kingdom” on the Planète Energies website.
- Ask students to calculate their personal energy consumption and how they might reduce it, in the light of the eco-citizen actions mentioned.
- Organize a visit to a production site (wind farm, solar power plant, etc.) to give them a tangible illustration of some of the information given on the factsheet.
 Geopolitics of energy
See all