Energy Consumption and CO2 Emissions in Europe and Worldwide
10 min read
Where does the European Union (EU) stand in terms of energy consumption and CO2 emissions compared to the United States, China or the African continent? In two tables, Planète Énergies explains the major world balances.

© Getty - Faced with the United States and China, faced with a developing Africa, Europe is a strong economic entity, attentive to climate issues
Comparative World Energy Consumption
Here is the total consumption of sources - before transformation in several major regions of the World, from 2000 to 2022. Figures are given in millions of “tons of oil equivalent” (Mtoe). Beyond the absolute value of these figures, it is interesting to compare them and look at how they have evolved through the years.
To sum up:
| In millions of toe | 2000 | 2010 | 2019 | 2020 | 2021 | 2022 | Share of global consumption |
|---|---|---|---|---|---|---|---|
| UE at 27 | 1,471 | 1,528 | 1,407 | 1,311 | 1,387 | 1,307 | 8.8% |
| China | 1,147 | 2,550 | 3,397 | 3,501 | 3,733 | 3,811 | 25.6% |
| United State | 2,273 | 2,216 | 2,212 | 2,035 | 2,139 | 2,173 | 14.6% |
Asia except China | 2,262 | 3,117 | 3,775 | 3,663 | 3,855 | 3,978 | 26,0% |
| Africa | 435 | 608 | 754 | 733 | 778 | 796 | 5,8% |
| World | 9,936 | 12,732 | 14,388 | 13,857 | 14,674 | 14,860 | 100% |
Comments on the table:
- The 27 countries of the EU consume less than a tenth of world energy.
- Consumption in the EU and the United States has declined since the year 2000, thanks to technological advances and efforts in terms of energy saving.
- China overtook the United States in 2010 and today consumes 75% more than it does.
- Consumption in Asia excluding China (India, Japan, Indonesia, etc.) has also increase over the past 20 years.
- The strong growth in 2021 is due to the economic recovery following the COVID-19 pandemic.
You can find detailed figures for the main energy-producing and energy-consuming countries here.
How much of the world's CO₂ energy does Asia consume (China, India, Japan, Indonesia, etc.)?
More than half.
Which continent represents 18% of the world's population but consumes less than 6% of the world's energy?
Africa.
Comment
The consumption of a geographical area is related to the number of inhabitants, but highly significant differences are sometimes observed that reflect the inequalities in living standards and development:
- The EU (606 million inhabitants) consumes almost twice as much energy as Africa (1.5 billion inhabitants).
- The United States (303 million inhabitants) consumes half as much energy again as the amount consumed by the EU (606 million inhabitants).
World CO2 Emissions
CO2 emissions are closely linked to the consumption of fossil fuels, particularly in transport, housing and industry. They tend to slow down or decrease during periods of slower economic growth.
Here is the evolution between 2000 and 2022. Quantities emitted are expressed in millions of tonnes of CO2.
| In millions of tons of CO2 | 2000 | 2010 | 2019 | 2020 | 2021 | 2022 | Share of Global Emissions |
|---|---|---|---|---|---|---|---|
| UE at 27 | 3,264 | 3,137 | 2,654 | 2,397 | 2,569 | 2,517 | 7% |
| China | 3,119 | 7,845 | 9,958 | 10,038 | 10,609 | 10,644 | 31% |
| United States | 5 730 | 5,352 | 4,745 | 4,258 | 4,549 | 4,608 | 14% |
| Asia except China | 5,041 | 7,140 | 8,878 | 8,551 | 8,990 | 9,332 | 27% |
| Africa | 661 | 1,022 | 1,246 | 1,199 | 1,262 | 1,262 | 4% |
| World | 23,235 | 30,583 | 32,308 | 30,881 | 32,690 | 32,986 | 100% |
For 2023, the figures (unconsolidated) showed a further increase of 1.1%. However, the notes that the increase no longer follows that of global GDP, which means that emissions have “decoupled” from growth. In any case, this increase is completely incompatible with the goal of carbon neutrality by 2050.
Comments on the table:
- China has become the world's biggest emitter of CO2: it emits more than twice as much as the US and four times as much as the EU.
- EU emissions are decreasing thanks to improved and energy-saving solutions. The significant decrease in the United States has been boosted by the gradual shift from to gas in the production of
- If the emissions are compared to the number of inhabitants, an African emits 14 times less than an American.
- World CO2 emissions decreased in 2020. The decrease in emissions however, is due essentially to the Covid pandemic which generated a drop in world economic growth.
How much of the world's emissions does Asia as a whole (China, India, Japan, Indonesia, etc.) generates?
58%
Who emits more CO₂ between Africa and the European Union?
The European Union emits twice as much.
Comment
A territory’s emissions do not always reflect its actual “ ”. For example, China produces a lot of export goods, which are consumed in Europe and the United States, but the CO2 emissions they generated are attributed to China. So the carbon footprint for Europe is approximately 30% higher than the footprint generated by its local consumption.
Source:
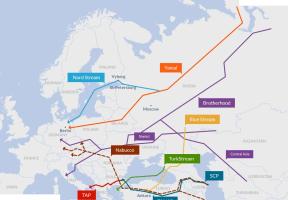
 Energy in Europe
See all