Global Wind Power Generation
Updated on 03.06.2024
Middle School
High School
Life and earth sciences
5 min read
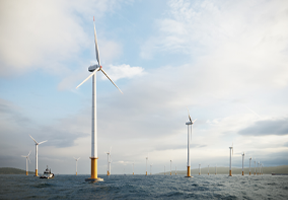
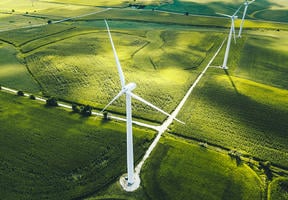
Wind continues to grow worldwide, with the development of wind. China and the United States are the two main wind producers, while in Europe, Germany and the United Kingdom dominate the market.
Global Wind Power Generation (in terawatt- hours – TWh)
| Country | 2021 | 2022 | 2021-2022 Change |
|---|---|---|---|
| China | 655.8 | 762.7 | +16.3 % |
| United States | 382.0 | 439.2 | +15 % |
| Germany | 114.6 | 125.3 | +9.3 % |
| Brazil | 72.3 | 81.6 | +12.9 % |
| India | 68.1 | 70.0 | +2.9 % |
| United Kingdom | 64.7 | 80.2 | +24 % |
| Spain | 62.1 | 62.7 | +1 % |
| France | 36.8 | 38.0 | +3.4 % |
| Canada | 34.8 | 37.5 | +8 % |
| Turkey | 31.4 | 35.1 | 11.8 % |
| Sweden | 27.1 | 32.6 | +20.3 % |
| Total World | 1,854.1 | 2,104.8 | +13.5 % |
Global Wind Power Generation.pdf
Global Wind Power Generation.pdf
 This may interest you
See all
Infographic

High School
Game

Elementary
Middle School
High School
Exercice
Middle School
Article

High School
Video

Middle School
Video
Elementary
Middle School
Article

Middle School
Article

High School
Infographic
High School
Feature Report

High School
Article